Analysts Expect Matt Ryan to Regress and the Numbers Agree
Jul 15, 2017
By: @DFS_mathlete
On the positive side Matt Ryan and the Atlanta Falcons had a historic offensive season in 2016. On the negative side it ended by allowing a historic comeback to the Patriots in the Super Bowl and then the departure of their offensive coordinator Kyle Shanahan. A lot of analysts are predicting that the Falcons offensive output and Matt Ryan will regress in 2017. Analytical guys are using the phrase “regression to the mean.” I want to layout a few stats on why negative regression should occur and what that would mean to Ryan’s stats.
The Numbers
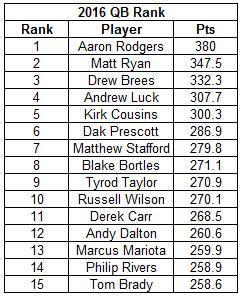
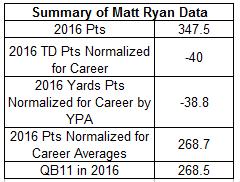
In 2016, MVP Matt Ryan finished 2nd in QB points with 347.5. He did this by throwing a career high in:
- TDs (38)
- Passing Yards (4944)
- Passing Yards per Attempt known as YPA (9.26)
- TD per Attempt known as TD% rate (7.1%)
- Completion Percentage (69.9%).
- Career low in INTs (7)
Matt Ryan was incredibly efficient in respect to rate stats such as YPA, TD% rate, and completion percentage. That type of efficiency is going to be hard, if not impossible, to repeat. When a player returns closer to their career averages that is often referred to as regression to the mean. It is statically common for extreme values (ie. career highs) to eventually return back closer to the average.
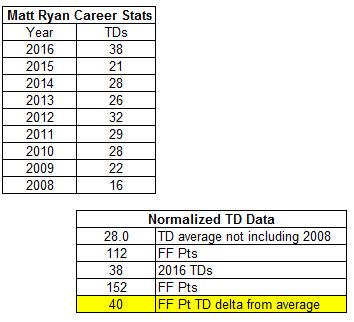
I broke down Matt Ryan’s 2016 passing TDs and Passing Yards per Attempt (YPA) by comparing them to his career average. This data alone shows why we should expect a negative regression and for Ryan to finish with 2017 stats closer to his career average.
In 2016 Ryan threw for 38 TDs. His career average, not including the limited 2008 season is 28. The extra 10 TDs in 2016 compared to his career average led to 40 extra fantasy football points.
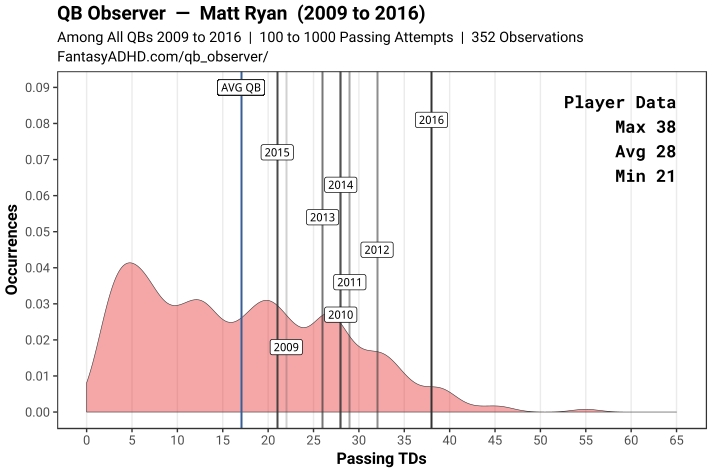
This career passing TD data (as well as other stats) can be looked at on a plot using @FantasyADHD QB Observer tool.
http://www.fantasyadhd.com/qb_observer/
From the picture it is clear that 2016 was well outside of typical Ryan season and is likely to negatively regress.
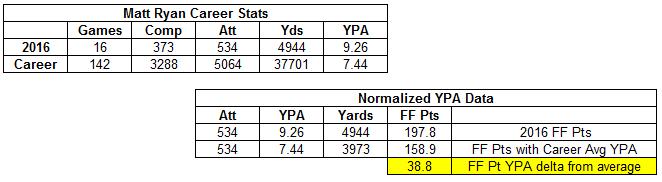
Ryan’s career average in pass yards per attempt (YPA) is 7.44. In 2016 he threw for 9.26. If you normalize his 2016 number of pass attempts with his career YPA then it would result in a reduction of 971 yards. This equates to a reduction of 38.8 fantasy football points.
Normalizing Matt Ryan’s 2016 TDs and YPA stats with his career averages (including his monster 2017 season) would have resulted a reduction of 78.8 points. This would have dropped him as QB11 in 2016. Just normalizing Ryan’s number of passing TD would drop him to QB5 in 2016.
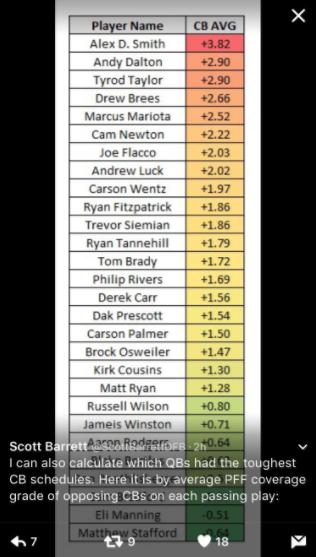
Scott Barrett (@ScottBarrettDFB) of Pro Football Focus tweeted which QBs had the toughest cornerback matchups in 2016. Matt Ryan had one of the easier cornerback schedules. This helps to support the fact that Ryan should regress on his rate stats.
Conclusion
When drafting the 2016 QB2 be aware that negative regression to the mean is coming. The career high stats and high rate of efficiency shows it is going to happen. If you aren’t an analytical person then you can also point to qualitative things such as a new offensive coordinator and the “super bowl hangover” as a reason for regression. @SMich_5 (fellow blogger on this site) summarized it well: Matt Ryan “went from underrated to overrated in one season.” In redraft leagues, Ryan’s current ADP per Fantasy Football Calculator is QB4 (pick #59 in PPR leagues). Ryan could hit that value but in my opinion you are drafting him at his expected regressed ceiling and I would rather have other players in that draft spot with better value. I’m targeting Ryan around QB8 which means I probably won’t have him on any of my teams.
More Articles